Summary
Understanding how people are utilizing a researcher's open source code is important for understanding the impact and benefit to the world. While the University of Michigan offers both GitHub Enterprise and GitLab Enterprise free of charge to research teams, collecting usage data is left up to the researchers. Moreover, the statistics that these services do provide are limited to the past 14 days only. This article explores a solution for capturing GitHub usage data on a daily basis and storing it into CSV, JSON or a database for future analysis.

Details
Problem
GitHub Enterprise offers "insights" for every repository, but those summary statistics are limited to the the previous 14 days. The data is also accessible through an API but it can be cumbersome to fetch and parse directly. An automated solution is needed to capture those statistics daily so researchers can see history as far back as needed, and with much more detailed data.
Solution
Scripts Overview
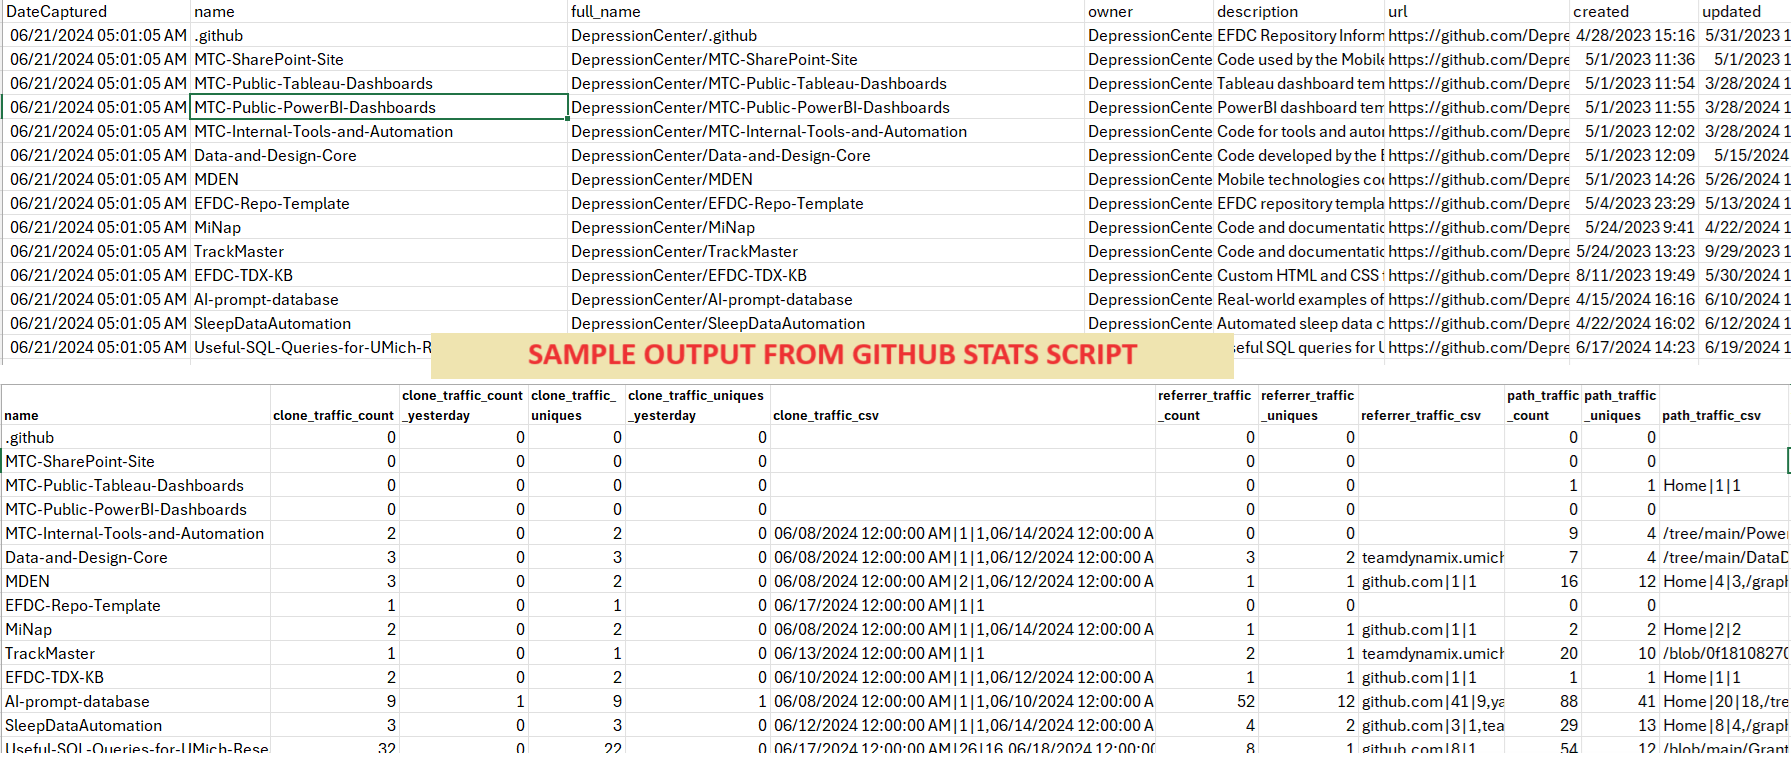
The Depression Center created a collection of scripts for automating the process of collecting and storing usage data from GitHub. By running the scripts daily, a researcher can keep track of downloads, clones, forks, views, referral sources and more over a long period of time. Changes to the repository itself are also captured, such as its topics (tags) and the last date of a push or commit. In addition, researchers can also get a list of GitHub users who are following (subscribing) or book marking (stargazing) each repository.
The code is completely free to use, and the requirements are minimum. Only a small server or virtual machine is needed (please contact HITS or ITS), with PowerShell installed. To access the data for visualization tools like Tableau or PowerBI, a file share or an Oracle database can be utilized.
How to Set Up
- Obtain a GitHub API key with read permissions to your organization.
- Set the following environment variables in your server:
GITHUB_USERNAME - the username of the owner of the API keyGITHUB_API_KEY - The API key obtained in the previous step
- Install the PowerShellForGitHub module by issuing this command in PowerShell:
Install-Module PowerShellForGitHub
- Download the PowerShell script from the Depression Center's repository at: https://github.com/DepressionCenter/GitHub-Usage-Stats/blob/main/PowerShell-Scripts/ExportGitHubUsageStatsForOrganization.ps1 and save it to c:\scripts (Windows) or ~/bin (Linux)
- Edit the settings at the top of the script, including the Organization Name variable.
- If you would like to run this for a personal account, user your GitHub username for this variable instead of an organization name.
- Create a directory for the output files, c:\GitHubStats or ~/GitHubStats, or as configured in previous step.
- Run the script in PowerShell.
- Grab the CSV or JSON files from the output directory. Files are replaced at each run, except for the "rolling" file which appends to previous days' data.
General Information
- The statistics will be dumped into both CSV and JSON files in the output directory, including:
- github-stats-{OrganizationName}.csv - today's snapshot in CSV format. File is replaced at each run. Recommended for loading into a database.
- github-stats-{OrganizationName}.json - today's snapshot in JSON format. File is replaced at each run. Recommended for loading into a database.
- github-stats-detailed-{OrganizationName}.json - today's snapshot in JSON format, with all detailed included. File is replaced at each run. It can be used for debugging and troubleshooting.
- github-stats-rolling-{OrganizationName}.csv - today's snapshot added to the same CSV, without deleting previous data. This file can be used to create reports directly in Excel, Tableau, PowerBI, etc. without the need for a database.
- All the counts not labeled "yesterday" are 14-day totals, not for an individual day.
- Note that all dates and times are in universal time (UTC), in the GMT time zone (+00:00). That's because GitHub uses GMT to mark a "day" - the most granular time period available - and by keeping things in GMT, reporting becomes easier.
Loading Into a Database
- The script(s) under the SQL-Databas-Scripts folder can be used to create a table to host and accumulate the data. It includes SQL comments for most columns to use in a data dictionary.
-
- Currently, the only script(s) available are for Oracle databases. Some work maybe required to use a different database engine.
- The PowerShell script does not currently save to the database directly. A data pipeline is needed to load the data into a database.
Creating visualizations
- Although outside the scope of this project, it is worth mentioning that the "rolling" CSV file can be used as-is in visualization tools like Tableau or PowerBI. It can also be further normalized or transformed into a star schema for reporting.
- Example of visualizations for repo usage in Tableau (using v1.0 of the script):

Notes
- All contributions are welcome! Help us improve this script or the documentation, or translate both into other languages. Simply send us a Pull request or an email.
Resources
About the Author
 |
Gabriel Mongefranco is a Mobile Data Architect at the University of Michigan Eisenberg Family Depression Center. Gabriel has over a decade of experience in data analytics, dashboard design, automation, back end software development, database design, middleware and API architecture, and technical writing.
| |
|