Summary
The University of Michigan's DataDirect tool offers U-M researchers customized, user-friendly access to Michigan Medicine clinical data. With options for cohort discovery, recruitment, and de-identified data output, DataDirect is a highly valuable resource for mental health research. In this article, I will walk through an example project showcasing how DataDirect can be used for clinical research at U-M. Throughout, I will offer tips and tricks I've learned as a user of the DataDirect tool. Note: DataDirect is hosted by the Data Office for Clinical & Translation Research and Precision Health. This tutorial is not intended to take the place of the user resources available through their offices. Instead, I will show how I have used these tools in my own work and point interested readers towards helpful resources. The DataDirect User Guide is one such resource.
This tutorial was presented as a webinar in May 2024. The slides can be downloaded in the attachments panel on the right, the recording of the webinar can be viewed below, and example data and Rmd for initial cleaning is available here.
In this tutorial
Introduction to example case
Step 1: Gaining access to DataDirect
Step 2: Identify cohort(s)
Step 3: Identify "output views" (variables to be downloaded)
Step 4: Clean data
Step 5: Analysis
An introduction to our example case
The example project I'll be highlighting features a research question from one of the EFDC Data & Design Core's Incubator program participants. He was interested in quantifying medication burden in older adults who have depression, centralized pain (which is pain that is mediated by central nervous system dysfunction and is often prescribed antidepressants for treatment), or comorbid depression and centralized pain. He wanted to test the hypothesis that having comorbid depression and centralized pain may result in inappropriate medication burden for older adults given overlapping physiological pathways of medications used to treat symptoms of each. I'll be referring to this project throughout the rest of the article.
Step 1: Gaining access to DataDirect
There are two versions of DataDirect: The Michigan Medicine DataDirect (MMDD; which is refreshed nightly) and Precision Health DataDirect (PHDD; which is refreshed quarterly).
Decide which version is right for you and your project depending on:
- Requirements for access: Both versions are available to faculty, staff, and students. Staff need to be sponsored by faculty (who have a PH membership) for PHDD; students need faculty sponsorship to use either. Also, the MMDD version requires a Level-2 password, access to a MM coreimaged computer, and access to the MM VPN, whereas the PHDD version only requires a Level-1 password and access to the campus VPN.
- What is available in each: Much of the same data are available in both versions. PHDD provides de-identified data while MMDD contains patient identifiers (including Protected Health Information, or PHI). However:
- From my own personal experience, more detailed and wider data are available in the MMDD. For example, the PHDD has data on medications that are filled at pharmacies, but the data are limited to only patients that participated in the Michigan Genomics Initiative and only to certain pharmacies. Pharmaceutical dispense information is more comprehensive in the MMDD version.
- Dates are shifted within-patient in the PHDD. This is to help help with de-identification. Importantly, the date shifting is all the same within patient and is just shifted by a few days or a couple of weeks. So patient A may have all their dates shifted by 2 weeks, for example, and patient B may be shifted by 1 week. As the user we don’t know how much each patients' dates have been shifted. But the good thing is that the temporality is maintained within patient with the date shifting. So we can be confident that even if the dates have been shifted, the time that spans between two dates within patient is accurate. MMDD dates are not shifted at all.
- Your plan for storing the data: MMDD data need to be stored on your own HIPAA compliant server. See UM's safe computing page on what is permitted for storing PHI. Dropbox Teams is approved for use with PHI and other sensitive (but not restricted) data. PHDD data need to be stored in PH's Secure Enclave Services, which means you will only be able to access the data while using a virtual desktop or server.
After connecting to either the MM or campus VPN, log in to either version of DataDirect at datadirect.umich.edu and authenticate using Duo. For our project, I logged in to MMDD given our need for more detailed pharmacy dispense data. Once you log in, you'll see the following:
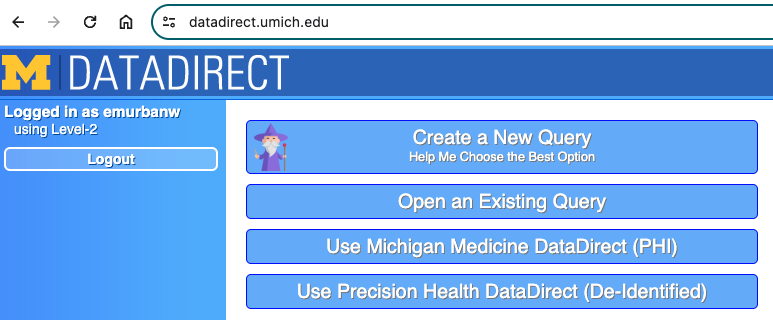
If you don't know the best option for what your needs are, click "create a new query" and you'll be taken through a series of prompts to figure out which DD version is best for you. If you already have an existing query, you can click that button and select it. Queries are automatically saved once they are created and re-saved consistently as they are updated.
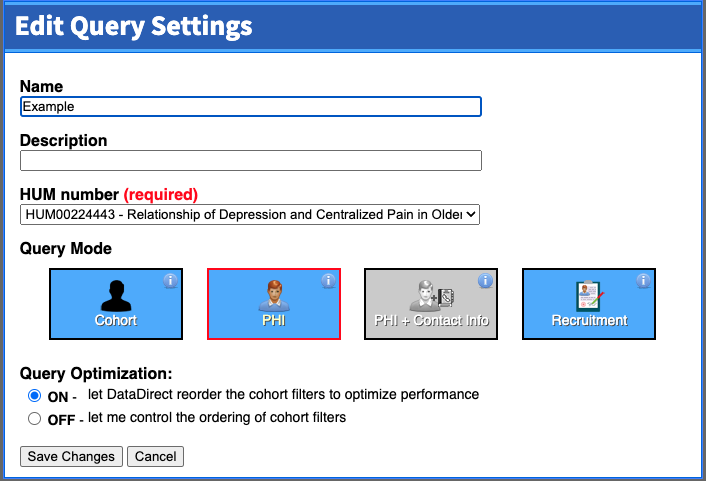
In our project, we chose to "Use Michigan Medicine DataDirect (PHI)". We then enter the query settings, as seen in the screenshot below. Note that if you don't yet have an IRB HUM number for the project, you can only use cohort mode. Cohort mode is useful if you are just looking to see how big your population is, and whether the research question you have is even feasible before submitting an IRB application to complete the project. Once you enter a HUM number for the project (and, for the MMDD version, it's approved for use with PHI), you'll see that query mode as an option.
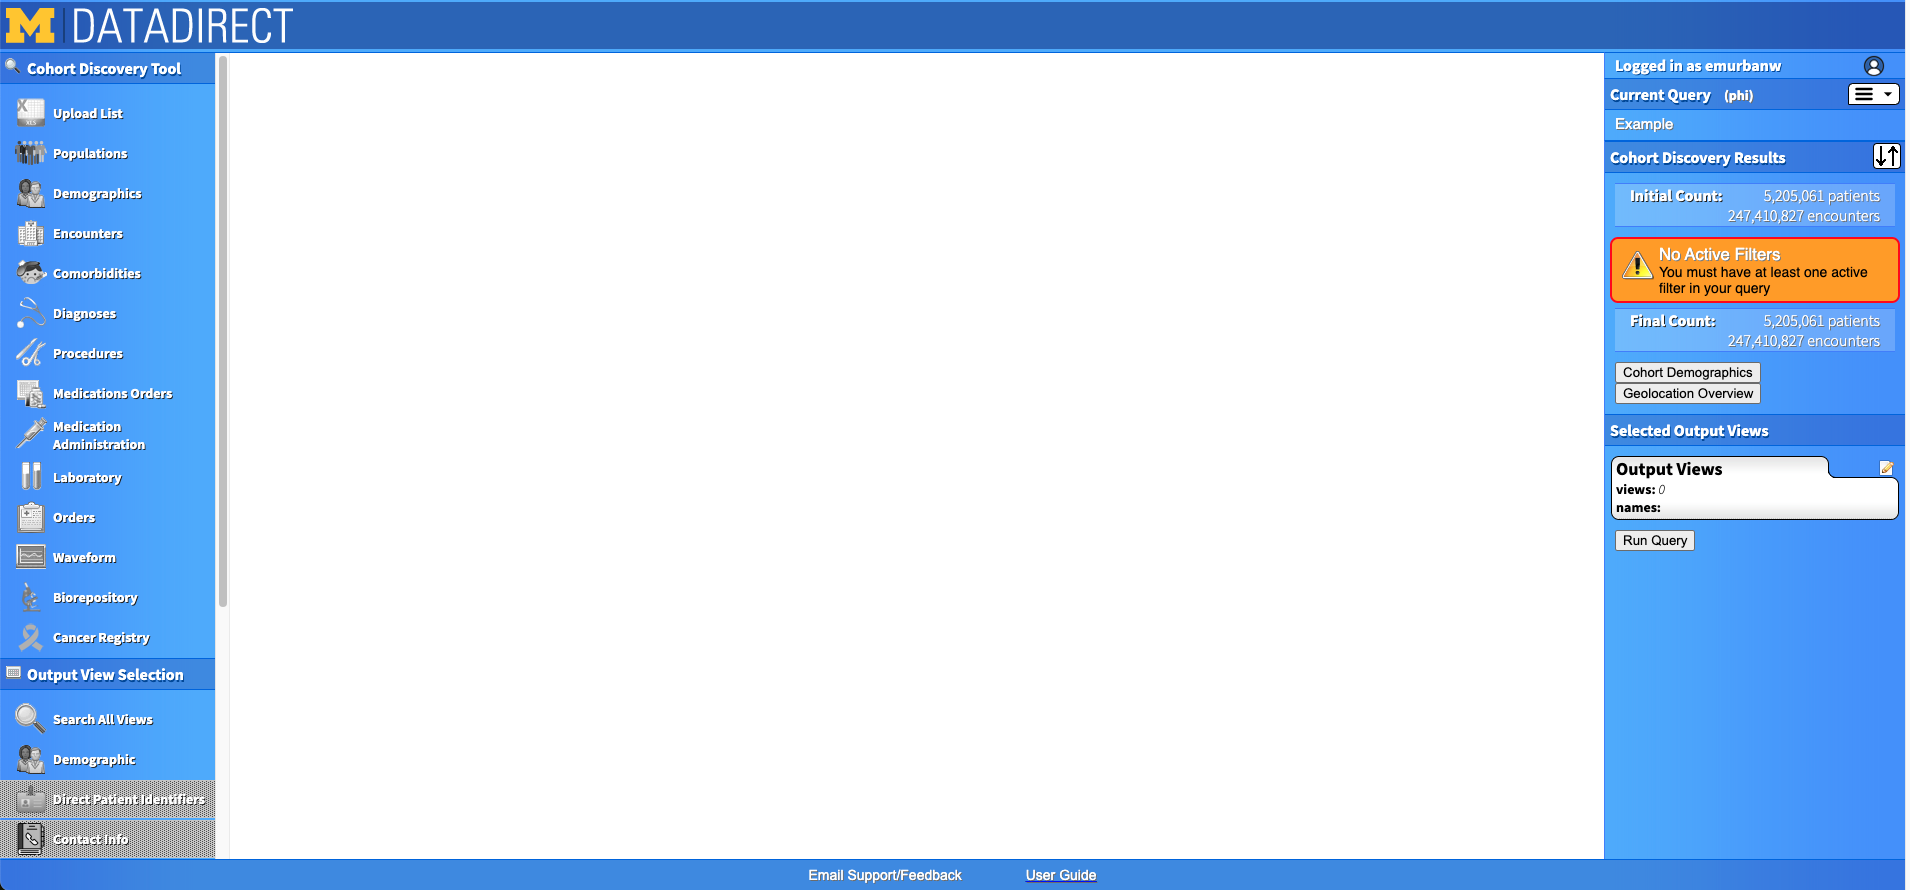
Once you've created a new query, you'll see the main DD page. On the left, you'll see a panel with "Cohort Discovery Tool" and its options on the top, then "Output View Selection" and its options on the bottom. On the right, you'll see the specifications of your query as you build it in a panel called "Cohort Discovery Results", and below that a panel that will contain your "Output Views". Now you're ready to start identifying your cohort.
Step 2: Identify cohort(s)
Before showing you how to identify your cohort in DD, here are some tips to get you started:
- Identify your main (theoretical) cohort of interest. What are it's characteristics? What are potential comparison cohorts? How do you plan to analyze data from those cohorts?
- If you want to compare cohorts, will you include them all in the same query or run separate queries for each cohort? Note that for MMDD, there is a maximum of 100k patients per query.
- In our example project, we were interested in three cohorts: those with depression (and no centralized pain), those with centralized pain (and no depression), and those with both. I could have downloaded all patients with either depression or centralized pain and then assigned to cohorts based on ICD codes after downloading the data. However, the number of patients would have been too large for one file download (in our case) and I wanted to let DataDirect do the heavy lifting for cohort assignment. Thus, I decided to run three queries and merge the data back together into one dataframe after downloading.
- How will you define your cohort(s) in DD?
- Demographic information (age, sex, race, etc.)
- Are you interested in any specific predefined populations? (e.g., MM primary care only, surgical patients, diabetes registry patients, etc.)
- Are there specific characteristics about the encounters with the patient you want to restrict your cohort based on? (e.g., range of dates, specific visit location or providers, etc.)
- Are there any specific medications, procedures, or diagnoses that must be present in your cohort? Or that must be absent in your cohort?
- Take your time gathering ICD codes, procedure codes, and medication lists. It can be helpful to log in to DD to help build these codes and lists in cohort mode if you don't have them already.
Let's start by narrowing the cohort down by a pre-configured population. On the left side of the site, you'll see the "Populations" tab. Once you click into it, it looks like this:
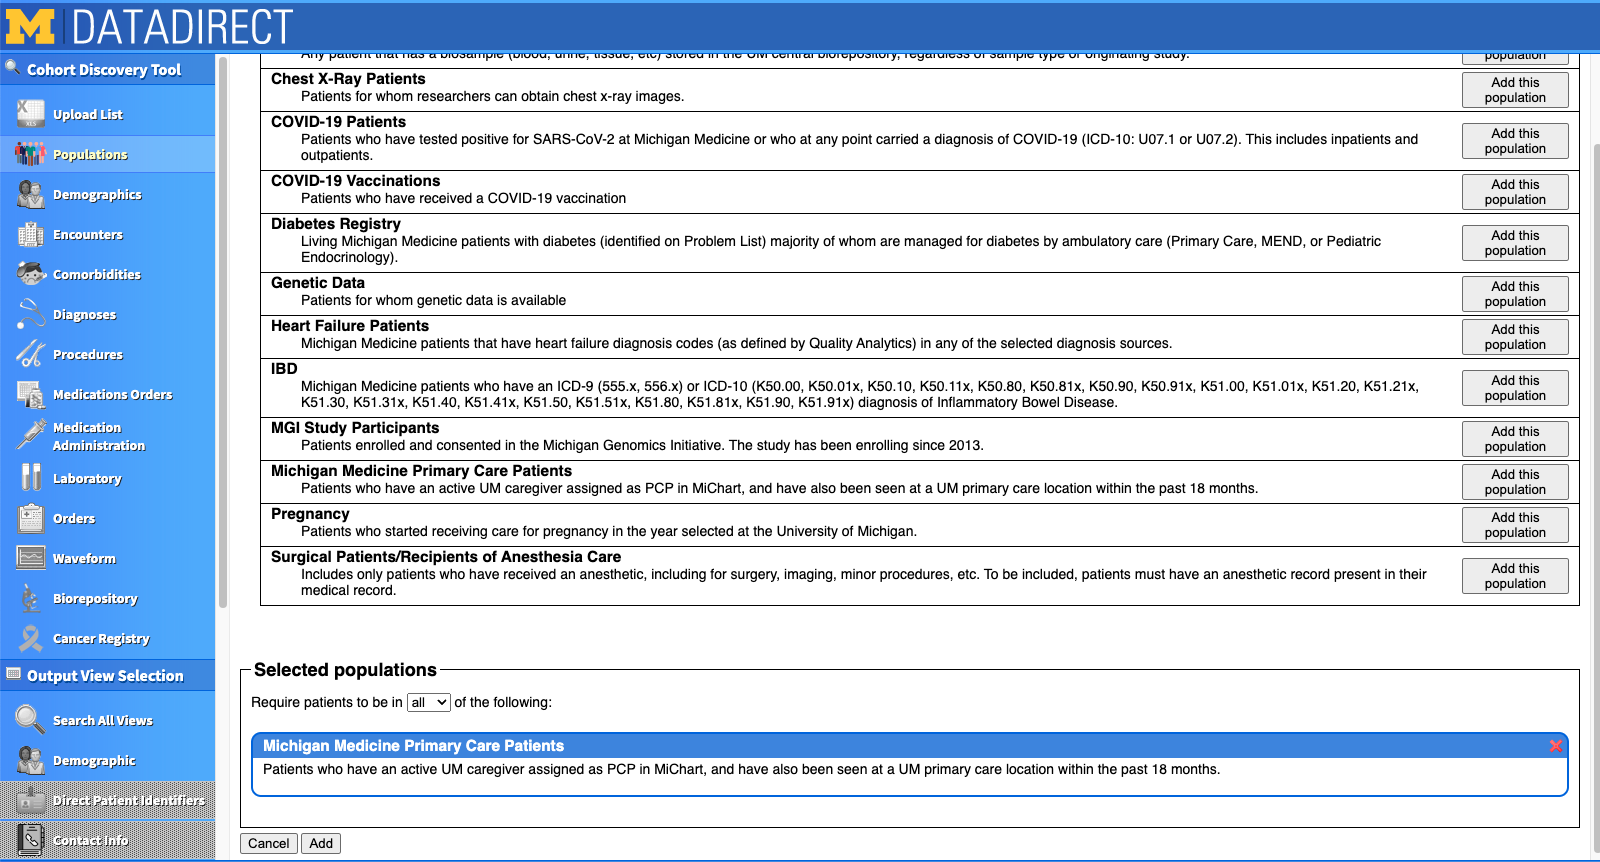
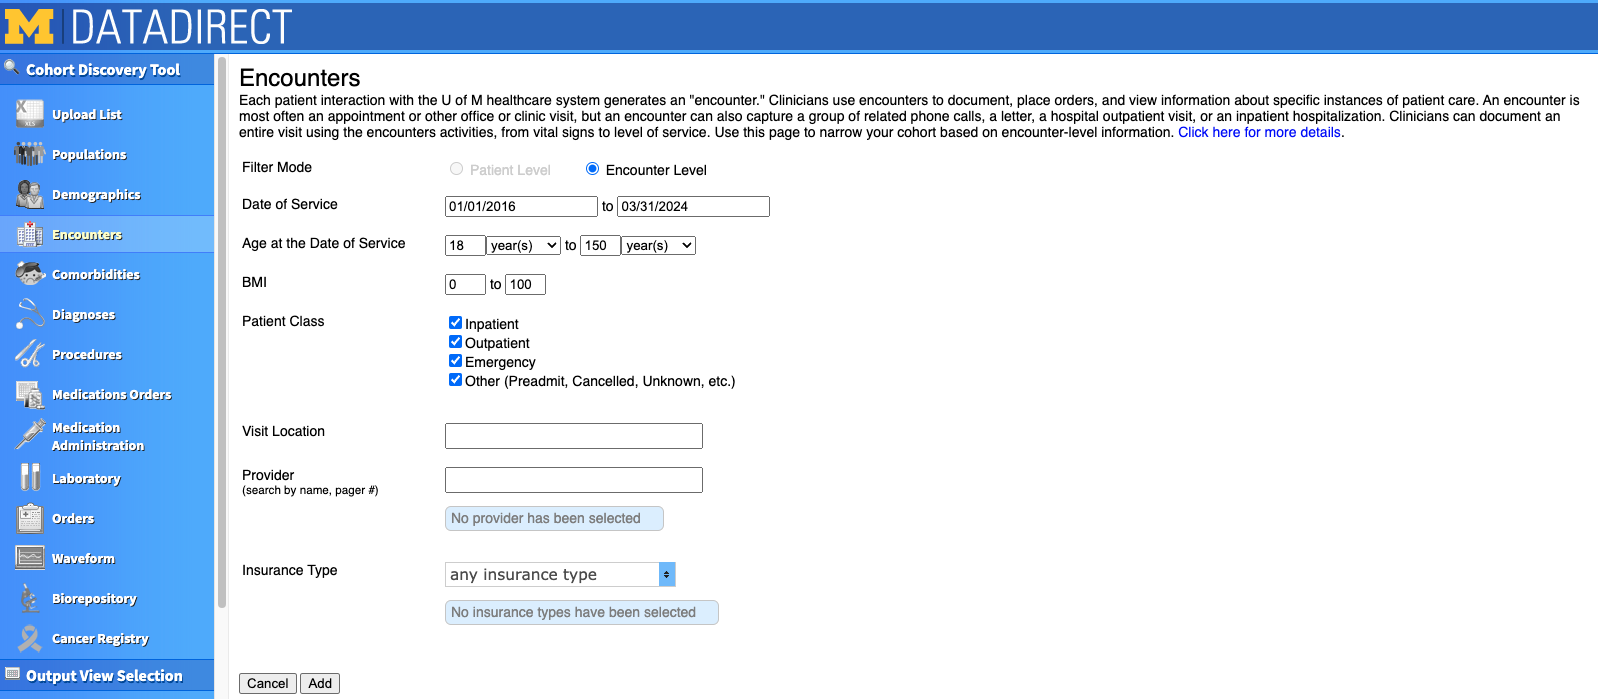
For our project, we chose to focus only on Michigan Medicine Primary Care Patients. I clicked "Add this population" on the right hand side, and saw it appear at the bottom of the screen under "Selected populations". If you want to restrict based on age or encounter dates, this information is actually in the "Encounters" tab. In our project, we were interested mostly in older adults, but decided to include all adults 18+ so that we'd have a comparison of our outcomes across the lifespan. We also decided to limit the range of encounter dates to 2016 to the present. We could further restrict based on type of visit (e.g., inpatient, outpatient, emergency), specific providers, and insurance type if we wished.
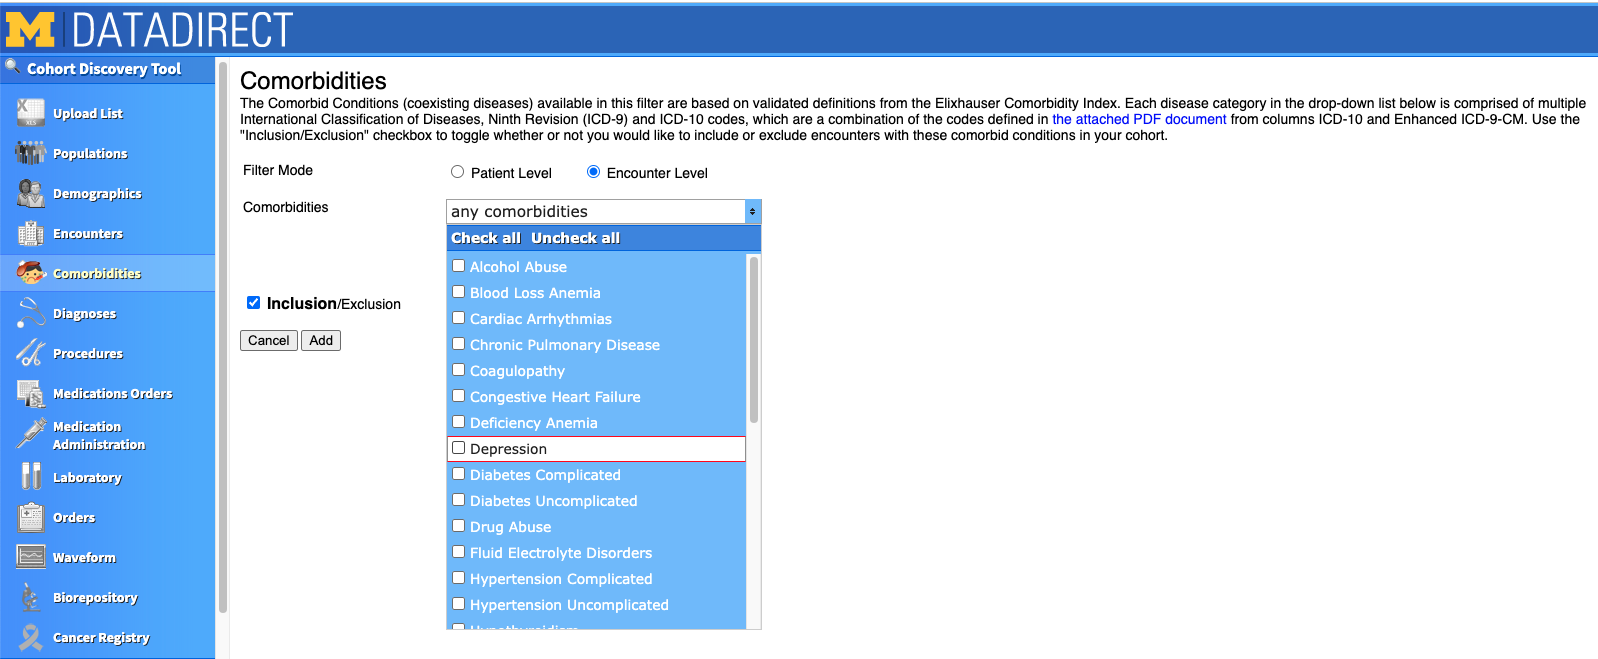
You can also select your patients based on Comorbidities. However, use this with caution! Be sure to investigate all the ICD codes that are documented in the tab's PDF for your comorbidity of interest. When I selected the "Depression" comorbidity, it gave me 416k patients! However, I found it included ICD codes that weren't relevant to our specific project, like Bipolar disorder. As a comparison, when I input the ICD codes we were actually interested in, it gave me around 200k patients.
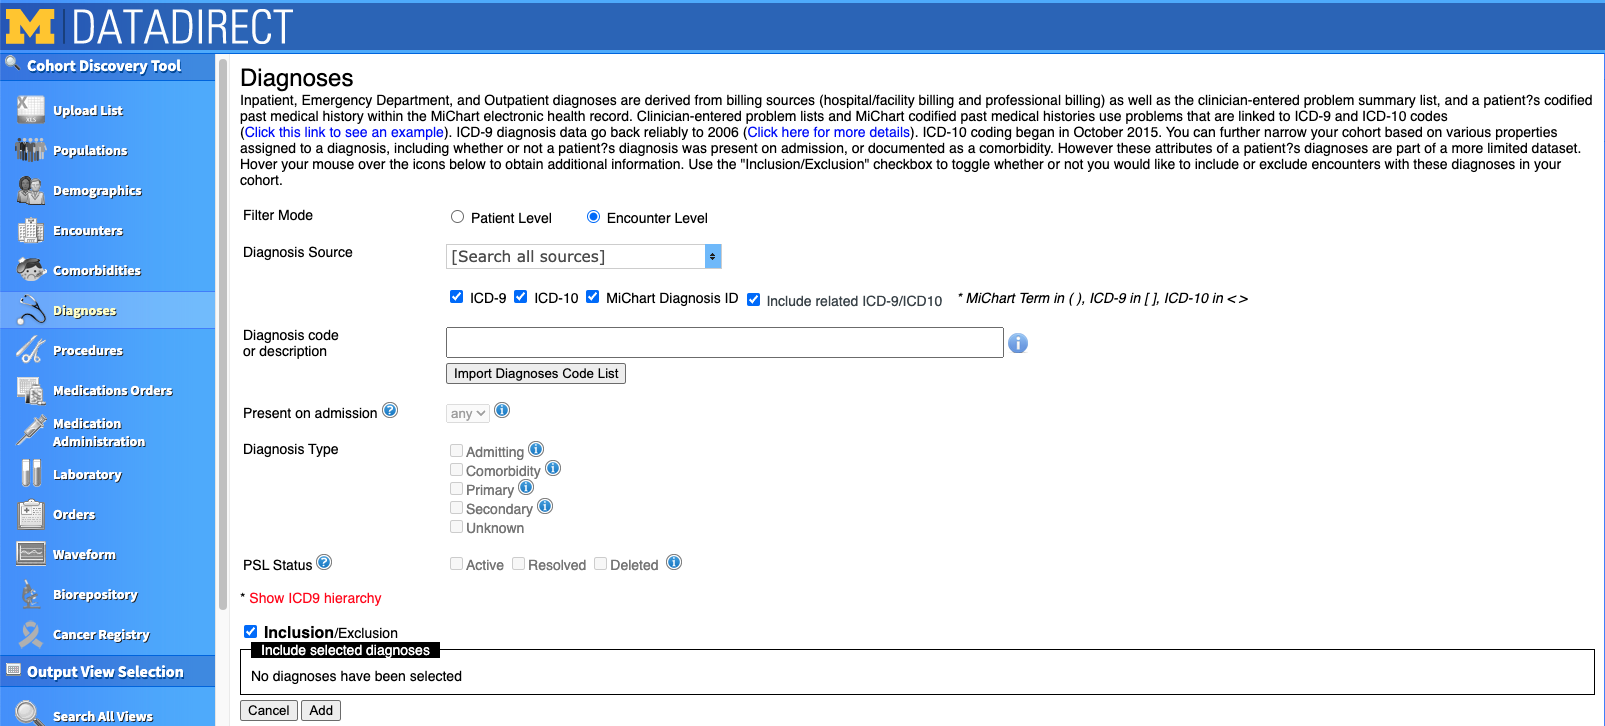
Instead of using the "Comorbidities" tab, we defined our cohorts based on the ICD codes we input in the Diagnoses tab. This is where we differentiated our cohorts based on who was diagnosed with depression, centralized pain, or both. You can either search for ICD codes in the search box or click the button to import a list of pre-determined ICD codes. The codes you select will appear at the bottom of the box, just under where it says "Inclusion/Exclusion". Note that when this checkbox is checked, the codes beneath it will be INCLUDED in your cohort. If the box is unchecked, people with those codes will be EXCLUDED from your cohort.
There are several other Cohort Discovery tabs you can use. For our example project, we only needed to define our cohort based on the Populations, Encounters, and Diagnoses tabs.
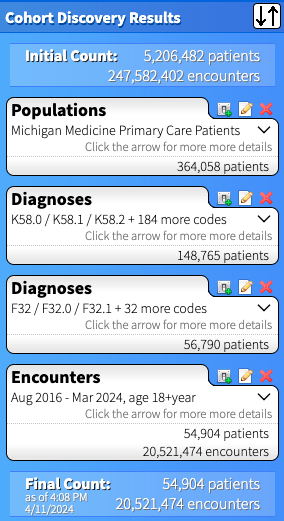
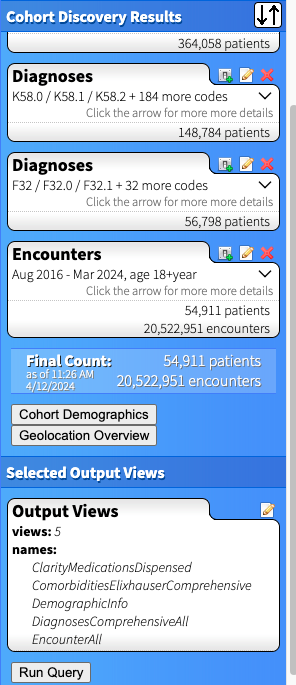
For each set of criteria you create, the right side of the DD page updates with patient counts for your cohort. Below is the outcome for cohort who had both centralized pain (the first set of Diagnoses) AND depression (the second set of Diagnoses). Note that each bubble below represents a criterion that must be present to be part of the cohort. If we wanted patients who had centralized pain OR depression, we'd include all the codes together in one Diagnosis search. If we wanted a cohort that DOESN'T have a set of ICD codes, for example people with depression but NOT centralized pain, we'd use the "Exclude" checkbox in the diagnoses tab (see screenshot just above) and it would appear as "exclude K58.0 / K58.1 / K58.2 + 184 more codes" in that specific Diagnoses bubble.
In our example, I decided to create three separate cohorts, thus will need to make two additional queries to the one above. I recommend first selecting the output views (outlined in the next step), then copying the query and modifying to your additional cohorts. This way you will guarantee that the same set of output will be generated for each cohort (and your data will merge more easily).
Step 3: Identify "output views" (variables to be downloaded)
Once you've identified your cohort, you can search for the information you'd like to be output about those patients in the "Output View Selection" panel on the left side of the page. I recommend spending time reading through the data that are available by clicking through the tabs and reading the Data Dictionaries.
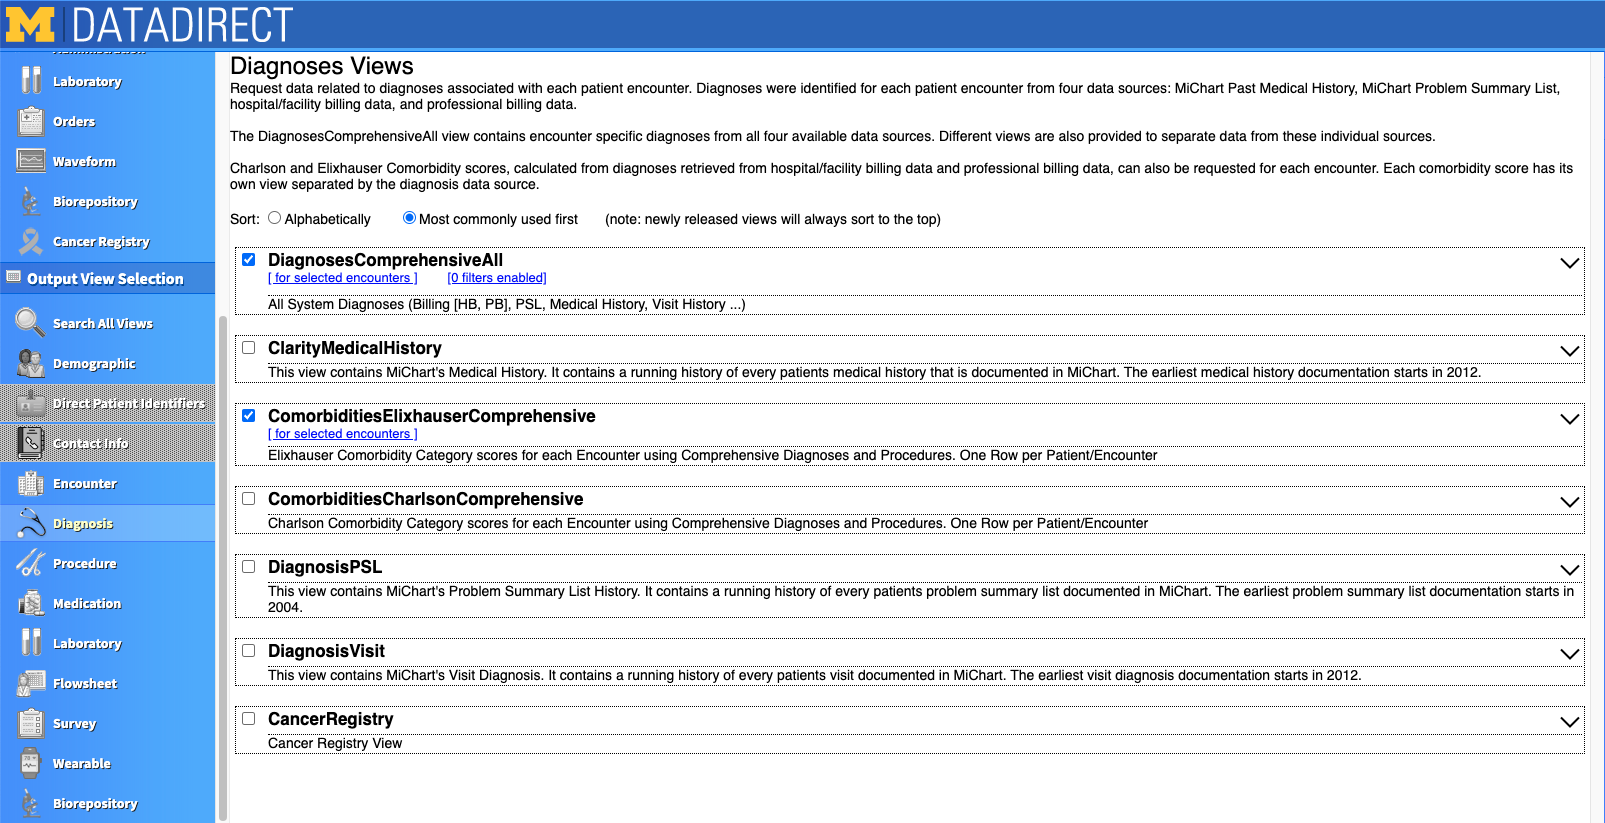
Let's take a look at the "Diagnosis" view. Once you click into that tab, you see there are several dataframes related to diagnosis information. Each rectangle is a separate output view. If the box is checked, that output view will be downloaded with your query. Below you can see we selected the "DiagnosesComprehensiveAll" and "ComorbiditiesElixhauserComprehensive" views.
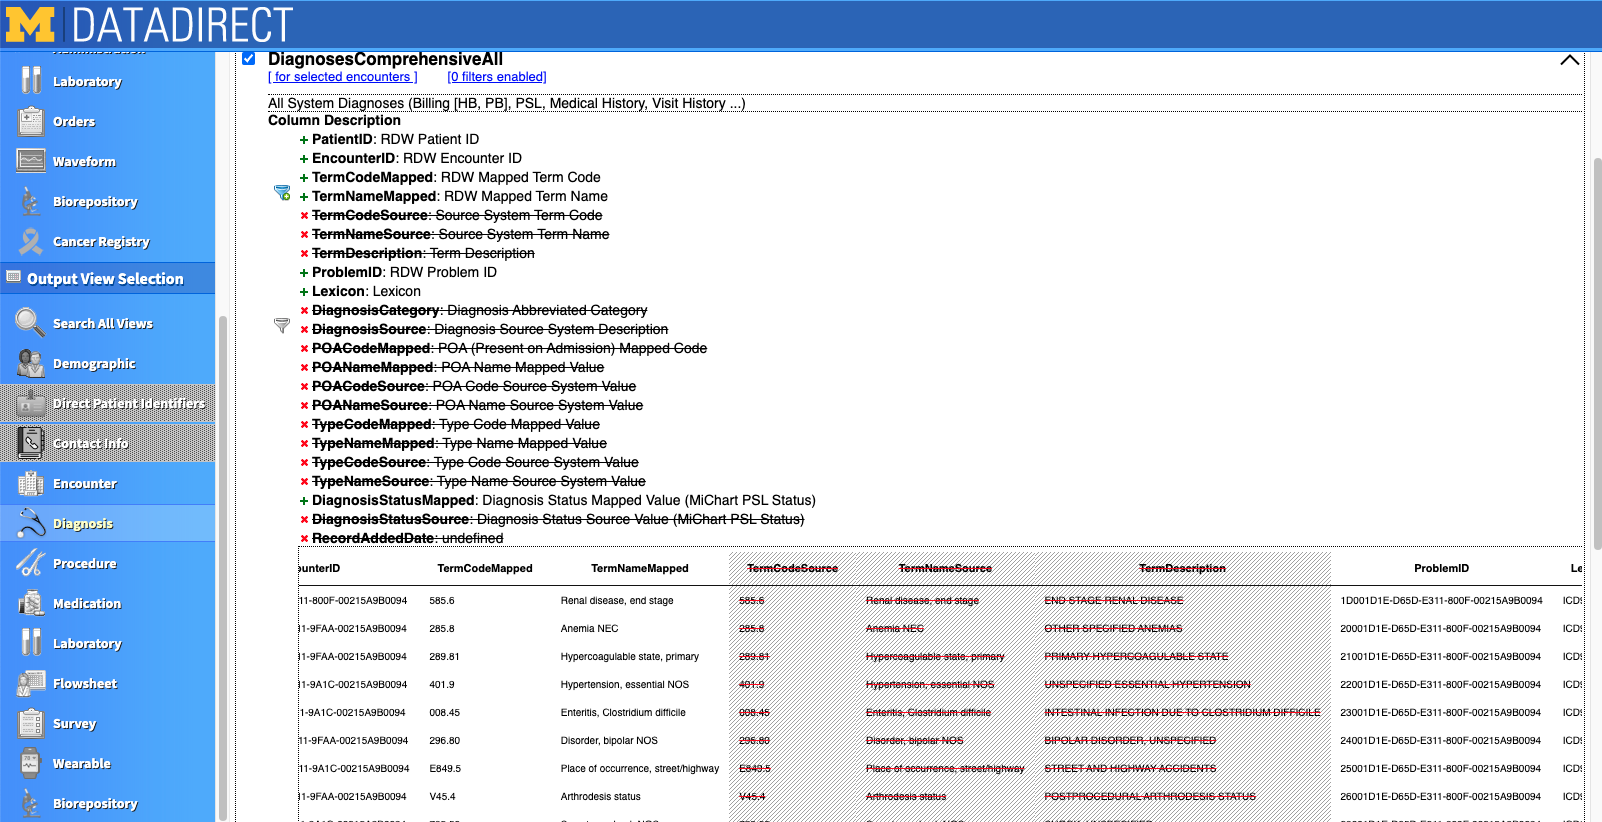
When you expand the output view by clicking the dropdown arrow on the right of the view, you'll see all the variables you can download as part of that view as well as a preview of simulated data (see screenshot below). Click the green + or red X to select or deselect a variable for your download. Variables with a funnel to the left can be used as filters. For example, the filter next to "TermNameMapped" can be used so that only the ICD termcodes you specify are downloaded into your file. This is helpful when you don't need an expansive list of diagnoses, for example, and also want to cut down on file size.
There are several other tabs and views that have an abundance of data. There is also a lot of redundancy between views (e.g., date of death may appear in multiple views). Although the DD tool does a great job, it is important to closely examine the data that is output. Sometimes data doesn't agree from one view to another (e.g., date of death may be missing in one view but not another).
Here are some of my go-to output views:
- Encounters → “EncounterAll” (this is a must if you want to link a date or patient age with a diagnosis ICD code)
- Diagnoses → “DiagnosesComprehensiveAll”
- Medications → “MedicationAdministrationsComprehensive” for inpatient administrations; “ClarityMedicationsDispsense” for dispense info from pharmacies)
Each Output View you select will appear on the bottom right side of the page in the "Selected Output Views" panel. Once you are ready, click "Run Query". You will be asked to create a password for your query, which will be used to open your data after it downloads. You also will create a filename and must read/agree to the attestations about properly protecting and storing your data. As per ITS's safe computing site, Dropbox Teams is one viable option for storing PHI data. Once the query runs, you will be emailed with a link to access your data in an xlsx workbook.
Step 4: Clean data
Your data are downloaded... now what?! It's time to clean it and prepare it for analysis. You'll need to merge the output views together within patient (i.e., put all the different workbook sheets together into one dataframe). This can get tricky as some output views contain multiple rows per patient (e.g., multiple encounters) and other views contain multiple rows per encounter (e.g., multiple diagnoses for each encounter). If you downloaded multiple cohorts you'll also have to append those dataframes together.
In our case, we have 5 output views for each of 3 cohorts, which means we have 15 dataframes to combine! Furthermore, in big datasets, the output views might be split into multiple worksheets. I use R to do this and have put together an R-markdown script on our team's github page that will help you through this process if you're looking for some help getting started.
Here are a few tips for cleaning your data:
- Check your cohorts! Make sure everyone meets the criteria you specified in your DataDirect query as you imagined it.
- Compare data from different output views (e.g., discrepant dates).
- Keep track of the number observations and variables when merging/appending, especially when combining dataframes with multiple ID variables (PatientID, EncounterID).
And here are some R-specific tips:
- Use “XLConnect” to open password protected xlsx files (below code requires "rstudioapi" as well and for you to define "pw_message").
- wb <- loadWorkbook(“datapath/filename.xlsx"), password = rstudioapi::askForPassword(pw_message))
- Df <- readWorksheet(wb, "Sheet1")
- Save large datasets in fst format (“fast-storage” file).
- Use the write.fst() and read.fst() functions from the “fst” library.
- Package “dplyr” has a fantastic set of tools.
- To format dates, I use the base R function “POSIXct” or package “lubridate”.
- encounters$encounter_date <- as.POSIXct(encounters$AdmitDate, format = "%m/%d/%Y")
- It may help to flag which rows include a certain medication or diagnosis.
- pharm$leuprolide_grep <- as.integer(grepl("leuprolide", pharm$MedDispenseDesc, ignore.case = TRUE)
Step 5: Analysis
Your analysis will, of course, be project specific. Perform all the previous steps with your final analysis in mind. What question are you trying to answer? What kind of statement are you hoping to make about your population of interest? What comparisons are necessary to answer these questions?
If you're looking for help with the analysis, here are a few places where you can find help:
Conclusion
I hope this tutorial has been helpful for you! Happy analyzing!
About the Author
 |
Emily Urban-Wojcik is the Statistician Lead for the Data & Design Core at the University of Michigan's Eisenberg Family Depression Center. Emily assists mental health researchers with study design as well as data cleaning, analysis, and interpretation. Emily earned her PhD in Social Psychology with a focus in Quantitative Methodology and has over 10 years of experience working with primary and secondary data.
| | |
|