Summary
This article aims to help you learn basic troubleshooting skills for when working on Great Lakes, what information is important to provide for support tickets and common questions asked about jobs. The commands in this article can be built upon to aid you in getting one step closer to resolution, finding a root cause or getting unstuck to proceed onto the next step.
As always, if you have questions or concerns while going through the learning material, please don't hesitate to stop by Office Hours (Monday's 2-3pm and Thursday's 3-4pm), our HPC related workshops, which will be linked below, or submit a ticket to arc-support@umich.edu.
"Go forth and compute!" - Dr. Charles Antonelli
Environment
High Performance Computing (HPC) on the Great Lakes cluster (non-sensitive data)
Troubleshooting HPC Jobs
Please do not only copy and paste the commands here. Any <value> placed within a greater and lesser than symbol will need to be replaced and the symbols removed. For example, if your uniqname is ‘umstudent’ then if you see ‘/home/<uniqname>’ in the instructions, write ‘/home/umstudent’.
- How to get helpful information for troubleshooting and support tickets
- Locating jobIDs on the command line
- squeue
Please Note: Also after submitting a job with a batch script, it will output a jobID.
- Locating jobIDs with Open Ondemand
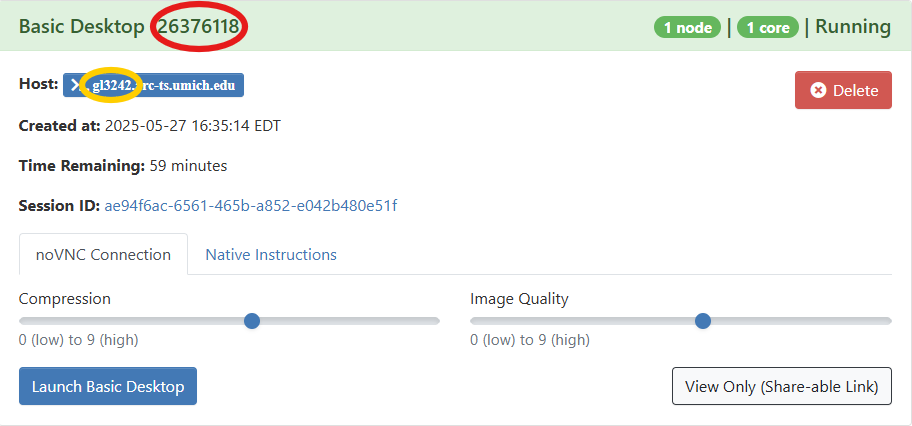
- Alt Text: Open OnDemand Basic Desktop window showing name of compute node, Job ID, Session ID, job time remaining, and buttons for Launch Basic Desktop and View Only (Shareable Link).
- The numbers in the top red oval is the jobID. This is usually the most helpful for troubleshooting HPC questions and to include in any tickets about the session.
- The content in the yellow oval is the compute node your session is running on. If your job is currently running, this can be helpful to include in your ticket.
- Session ID is useful for troubleshooting Open OnDemand system issues. Warning or notifying banners are displayed above “My Interactive Sessions”.
- Open OnDemand > Jobs > Active Jobs > chevron > Job Details & Output Location > Please send this information to us when sending in a ticket along with what software and size of dataset
- Why is my Open Ondemand session not launching?
- Is there a banner warning on the site indicating that the home directory is at capacity?
- If yes, are you unfamiliar with how to access the cluster from the command line? Please refer to Phase 1 of the HPC Self Guided Practice if not.
- Once logged into the cluster, you can use the following commands to check disk space:
- home-quota
- Outputs your Used and Available space as well as File Count
- du -S -h /home/$USER | sort -r -h | less
- Command that shows you the disk usage in your home directory, sorts it by size (largest first), and displays the output in a scrollable pager.
- After reviewing which directories and files are taking up the most space, decide if you want the file to be removed, moved to another location such as Turbo or transfer the file from your home directory to your local device with one of the File Transfer tools mentioned in Phase 1.
- rm </path/to/file/toBEremoved.ext>
Please Note: This command can be unforgiving, as it removes items right away without being able to undo the action. If you are wanting to remove data this way, always make sure the path or the file's full name is correct.
- mv or cp </path/to/file/toBEmoved.ext> </nfs/turbo/lsa-<uniqname>/Destination>
Please Note: We suggest before running it that you double check your path and items to ensure they are going to the correct spot before hitting enter.
- cp -pr <Source> <Destination>
- Recursively copies files while preserving timestamps
- How to access, manage, transfer or restore Data Guide from Phase 2 of this practice
- Why is my job not running or taking so long to start?
- Jobs can be in the PENDING state for a multitude of reasons ranging from Slurm scheduling the requested resources or reaching a resource account limitation. We will define some of those reasons below and how to check.
- squeue -u <uniqname>
- Slurm Pending reasons:
- Dependency – the pending job is waiting for another job to complete
- Priority – the job is not high enough in the queue
- Resources – the job is high in the queue, but there are not enough resources to satisfy the job’s request
- Partition Down – the queue is currently closed to running any new jobs
- DRAIN means that no new jobs will be started on that node, only currently running jobs will be allowed to complete. Sometimes a node gets into this state because of problems releasing resources after a previous job has ended.
- For the complete list, see the “JOB REASON CODES” section under the squeue man page.
- Slurm User Guide
- Slurm cheat sheet PDF
- Available Tools to check on resources for a partition:
- sstate -p <partition>
- sinfo -partition <partition>
- These tools can be used with grep, the sort command and others to find specific information.
- Long running Jobs on Great Lakes
- Questions to consider:
- How many resources were requested?
- How large is the dataset you are working with?
- Compared to smaller subsets or test jobs were the resources changed to match the current job?
- Check the Output and Error logs
- If they weren’t defined in the Batch script, they cannot be added while the job is running and we suggest defining them in the Batch script before running the next job.
- Commands:
- To estimate how much a job may cost:
- If the job completed and you want to refine the resources requested by checking how efficient the job ran:
- my_job_statistics <jobID>
- While a job is running you may ssh into the compute node(s) your job is running on and use commands:
- top
- Monitoring command line tool to check a job on a node, and to keep an eye on system resources.
- htop
- Similar monitoring tool to top, but newer and adds color with a more interactive interface.
- nvtop
- Monitoring tool for GPUs. Will need to be installed in your home directory to use.
- The less command can help you page through log files for completed or failed jobs. The location of the logs can be specified in your batch script as a Slurm Directive.
- less <nameOFfile.log>
- tail -f <nameOFfile.log>
- Actively follows the logs output in real-time.
- Command for listing files opened by currently running Linux processes. Use with the -o option to show where in a file the process is currently reading from or writing to. This is useful in determining if the process is reading a large file sequentially and to estimate how long it will take to read the entire file.
- lsof
- Log in to the compute node where the job is running
- Obtain the process ID of the process you are interested in monitoring by using the top or htop command
- Enter the command
lsof -o -p <processID>
- Toward the end of the listing you'll see lines each showing the absolute pathname of a file the process has open, whether it is open for reading, writing, or both, and the file location currently being read or written
- By repeatedly running the lsof command and noting the changes in file location it is possible to get a rough estimate of the time it will take to read the entire file
- Read the Docs
- man lsof command gives all options and usage examples
- Linaro tools [module load intel openmpi linaro-forge]
- perf-report
- Run and monitor an MPI or OpenMP program; a performance report file measuring time spent in MPI or OpenMP, I/O and CPU with breakdowns and tuning advice is written to the current directory in both .html and .txt formats.
- ddt
- Graphical debugger for parallel programs (MPI or OpenMP)
- map
- Graphical performance analyzer for parallel programs (MPI or OpenMP)
- User manual for all three commands
- ddt and map require a graphical session:
- Start an Open OnDemand session
- Open a terminal window and enter
- module load linaro-forge
- ddt <programname>
or
map <programname>
External resources
Links to external documentation are embedded within this documentation.